| |
Indicator 2.1 Mean Years of Schooling of Population 15 Years and over |
|
| |
|
|
• |
Mean years of schooling is an overall indicator of the population’s potential for human and social development. It also reflects the society’s capacity to provide an adequate and equal opportunity for education. |
|
|
|
|
| |
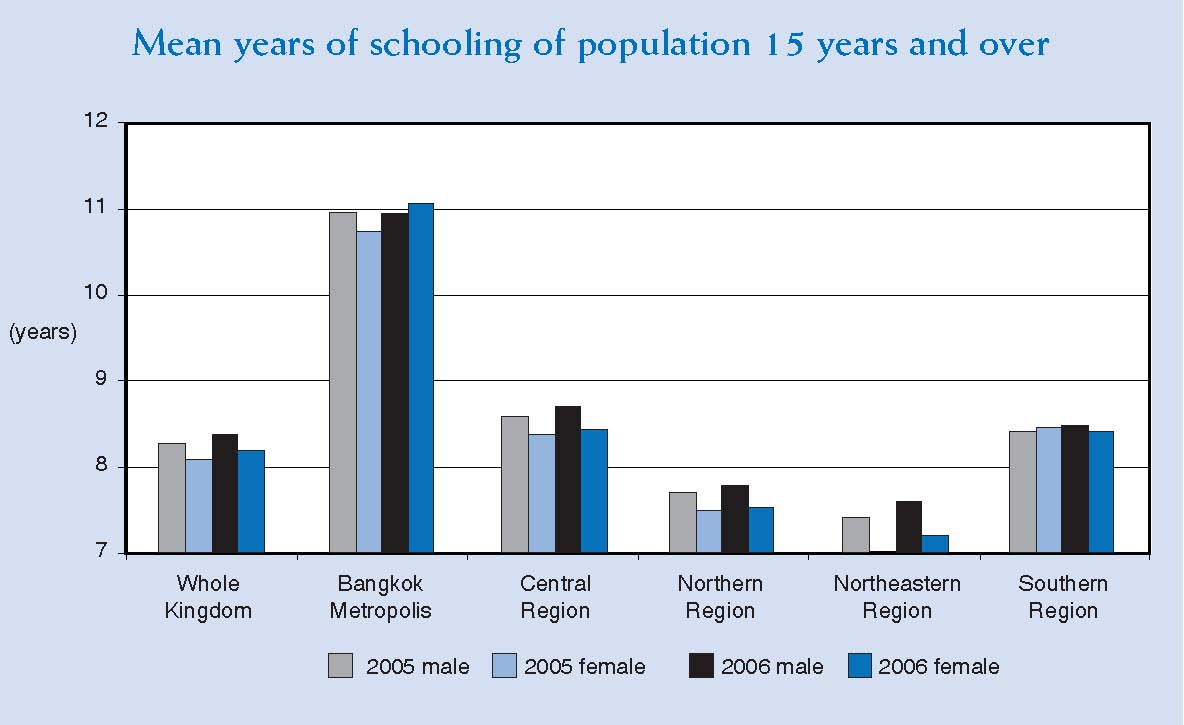
Mean years of schooling |
|
| |
|
|
• |
Mean years of schooling of population 15 years and over increased from 8.2 in 2005 to 8.3 in 2006. Men were slightly better off than women. But the largest gap was between the urban and rural areas. Bangkok had the highest mean years of schooling, and women had more years in school than men. The Northeast lagged behind other regions. |
|
• |
|
|
• |
Mean years of schooling of population 15 years and over by sex, administrative area, and region |
|
| |
|
|
| |
 |
|
• |
|
|
• |
| Mean years of schooling of population 15 years and over |
|
2005 |
2006 |
| male |
female |
total |
male |
female |
total |
| Whole Kingdom |
8.3 |
8.1 |
8.2 |
8.4 |
8.2 |
8.3 |
| municipal area |
10.1 |
9.9 |
10.0 |
10.1 |
10.0 |
10.0 |
| non-municipal area |
7.5 |
7.2 |
7.3 |
7.6 |
7.3 |
7.5 |
| Bangkok Metropolis |
11.0 |
10.7 |
10.8 |
10.9 |
11.1 |
11.0 |
| municipal area |
11.0 |
10.7 |
10.8 |
10.9 |
11.1 |
11.0 |
| Central Region |
8.6 |
8.4 |
8.5 |
8.7 |
8.4 |
8.6 |
| municipal area |
9.8 |
9.5 |
9.6 |
9.7 |
9.4 |
9.5 |
| non-municipal area |
8.0 |
7.8 |
7.9 |
8.2 |
8.0 |
8.1 |
| Northern Region |
7.7 |
7.5 |
7.6 |
7.8 |
7.5 |
7.7 |
| municipal area |
9.5 |
9.1 |
9.3 |
9.5 |
9.2 |
9.3 |
| non-municipal area |
7.2 |
7.1 |
7.2 |
7.4 |
7.1 |
7.2 |
| Northeastern Region |
7.4 |
7.0 |
7.2 |
7.6 |
7.2 |
7.4 |
| municipal area |
9.4 |
9.0 |
9.2 |
9.6 |
9.1 |
9.4 |
| non-municipal area |
7.1 |
6.7 |
6.9 |
7.2 |
6.8 |
7.0 |
| Southern Region |
8.4 |
8.5 |
8.4 |
8.5 |
8.4 |
8.4 |
| municipal area |
9.9 |
10.0 |
9.9 |
9.9 |
9.8 |
9.9 |
| non-municipal area |
8.0 |
8.0 |
8.0 |
8.0 |
7.9 |
8.0 |
|
|
| |
|
|
| |
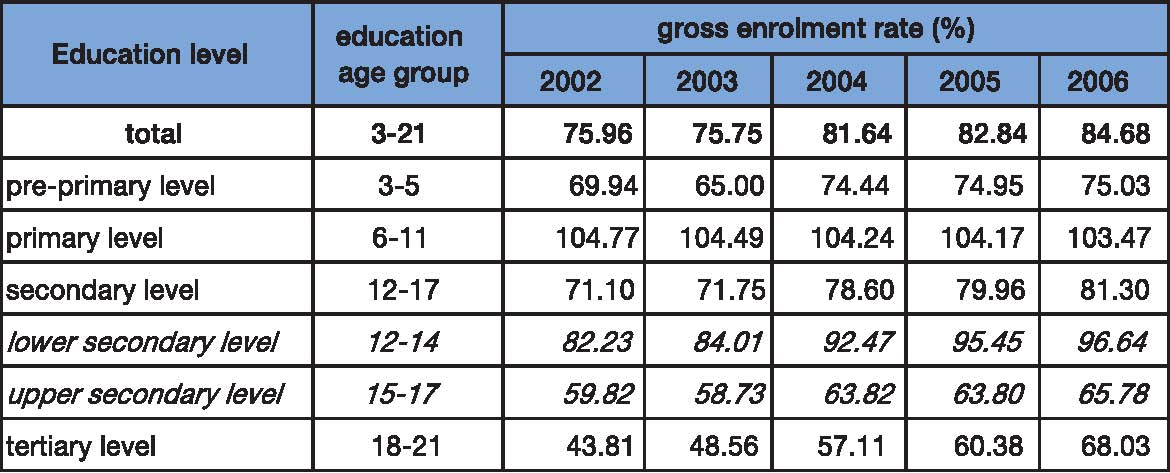
Indicator 2.2 Gross Enrolment Rate |
|
| |
|
|
• |
Gross enrolment rate shows the government’s capacity to provide access to education to children and the youth in every area of the country. |
|
| |
|
|
• |
Gross enrolment rate by education level |
|
| |
|
|
| |
 |
|
| |
|
|
| |
Indicator 2.3 Female and Male Gross Enrolment Rates |
|
| |
|
|
• |
Gross enrolment rates by sex is a measure of equal access and opportunity for education of girls and boys as well as the government’s capacity to provide education to children and youths in every part of the country. |
|
| |
|
|
| |
Enrolment rates of girls and boys |
|
| |
|
|
| • |
Girls and boys in Thailand have equal access and opportunity for education. The nine-year mandatory education has mobilized all children and youth into the school system to complete lower secondary education. As a consequence, the enrolment rates for both sexes at the primary and lower secondary levels were very high. The rates dropped off at the upper secondary and tertiary levels, where women scored higher enrolment rates. |
|
| |
|
|
• |
Gross enrolment rate by sex, and education level |
|
|
|
|
|
| Education level |
Education
age
group |
2006 academic year |
population (number) |
students (number) |
gross enrolement rate (%) |
male |
female |
total |
male |
female |
total |
male |
female |
total |
total |
3-21 |
8,840,867 |
8,424,009 |
17,264,876 |
7,273,294 |
7,347,365 |
14,620,659 |
82.3 |
87.2 |
54.7 |
pre-primary level |
3-5 |
1,215,348 |
1,146,766 |
2,362,114 |
910,500 |
861,690 |
1,772,190 |
74.9 |
75.1 |
75.00 |
primary level |
6-11 |
2,826,694 |
2,678,900 |
5,505,594 |
2,941,634 |
2,754,827 |
5,696,461 |
104.1 |
12.8 |
103.5 |
lower secondary level |
12-14 |
1,475,887 |
1,401,935 |
2,877,822 |
1,408,653 |
1,372,362 |
2,781,015 |
95.4 |
97.9 |
96.6 |
upper secondary level |
15-17 |
1,454,705 |
1,386,807 |
2,841,512 |
873,936 |
995,098 |
1,869,034 |
60.1 |
71.8 |
65.8 |
tertiary level |
18-21 |
1,868,233 |
1,809,601 |
3,677,834 |
1,138,571 |
1,363,388 |
2,501,959 |
60.9 |
75.3 |
68.0 |
|
|
|
Indicator 2.4 Retention Rate |
|
|
|
|
| • |
Retention rate indicates the ability of students to stay in the school system. Some students may have to drop out of school, which represents lost opportunity for both the students and the society. Drop-out students face difficulties in obtaining and qualifying for good positions in the job market. |
|
| |
|
|
|
Student retention |
|
|
|
|
• |
During 1994-2005, retention rate at the primary level was 79.1%, a noticeable decline from 85.9% during 1991-2002. No significant change was observed at the lower and upper secondary levels. |
|
| |
|
|
| |
| Education level |
|
1991 - 2002 |
1992 - 2003 |
academic
year |
students
(number) |
retention
rate (%) |
academic
year |
students
(number) |
retention
rate (%) |
| Grade 1 |
1991 |
1,235,292 |
100.0 |
1992 |
1,991,682 |
100.0 |
| Grade 6 |
66
1996 |
1,0611,670 |
85.9 |
1997 |
962,475 |
80.8 |
| Grade 9 |
1999 |
774,625 |
62.7 |
2000 |
764,866 |
64.2 |
| Grade 12 |
2002 |
522,415 |
42..3 |
2003 |
510,807 |
42.9 |
|
|
|
| Education level |
|
1993 - 2004 |
1994 - 2005 |
academic
year |
students
(number) |
retention
rate (%) |
academic
year |
students
(number) |
retention
rate (%) |
| Grade 1 |
1993 |
1,211,568 |
100.0 |
1994 |
1,150,902 |
100.0 |
| Grade 6 |
1998 |
927,591 |
76.6 |
1999 |
910,026 |
79.1 |
| Grade 9 |
2001 |
741,816 |
61.2 |
2002 |
770,883 |
64.4 |
| Grade 12 |
2003 |
491,427 |
40.6 |
2004 |
482,730 |
41..9 |
|
|
| |
Indicator 2.5 Ratio of Female to Male Students in Selected Subjects of Tertiary Education |
|
| |
|
|
• |
Ratio of female to male students in tertiary education indicates the equality of access and opportunity in higher education. The predominance of male or female students in selected subjects may reflect unequal opportunity, preferences, or the influence of social perception on gender roles. |
|
| |
|
|
| |
Tertiary education |
|
|
|
|
| • |
In tertiary education, women outnumbered men in Humanities, Religion and Theology, Medicine and related subjects, Social Science, Education, and Teaching. Men outnumbered women in Engineering, Law, Agriculture, Forestry and Fishery, Fine and Applied Arts. In recent years, more women chose to study Law while more men were enrolled in Humanities, Religion and Theology, Medicine and related subjects. |
|
| |
|
|
• |
Ratio of female to male students in selected subjects in tertiary education |
|
| |
|
|
| |
| Tertiary education classified by ISCED |
1997 |
1998 |
1999 |
| male(number) |
female(number) |
total(number) |
female/male ratio |
male(number) |
female(number) |
total(number) |
female/male ratio |
male(number) |
female(number) |
total(number) |
female/male ratio |
| Total |
368,788 |
380,734 |
749,522 |
1.03 |
391,671 |
416,429 |
808,100 |
1.06 |
395,471 |
432,564 |
828,035 |
1.09 |
| 1. Teacher training and education science |
24,082 |
32,900 |
56,982 |
1.37 |
25,771 |
37,481 |
63,252 |
1.45 |
27,608 |
41,792 |
69,400 |
1.51 |
| 2. Humanities, religion and theology |
4,672 |
17,368 |
22,040 |
3.72 |
5,771 |
20,143 |
25,914 |
3.49 |
6,304 |
21,887 |
28,191 |
3.47 |
| 3. Fine and Applied Arts |
1,838 |
1,481 |
3,319 |
0.81 |
2,785 |
2,115 |
4,900 |
0.76 |
3,109 |
2,292 |
5,401 |
0.74 |
| 4. Law |
85,289 |
21,520 |
106,809 |
0.25 |
87,484 |
26,320 |
113,804 |
0.30 |
85,569 |
29,965 |
115,534 |
0.35 |
| 5. Social sciences and business |
161,229 |
224,324 |
385,553 |
1.39 |
168,000 |
240,117 |
408,117 |
1.43 |
167,101 |
241,193 |
408,294 |
1.44 |
| Social and behavioural science |
83,878 |
56,540 |
140,418 |
0.67 |
92,155 |
66,644 |
158,799 |
0.72 |
93,956 |
72,487 |
166,443 |
0.77 |
| Business and administration |
60,722 |
132,351 |
193,073 |
2.18 |
58,230 |
135,611 |
193,841 |
2.33 |
55,822 |
130,678 |
186,500 |
2.34 |
| Journalism and information |
16,277 |
31,336 |
47,613 |
1.93 |
17,226 |
33,851 |
51,077 |
1.97 |
16,859 |
33,982 |
50,841 |
2.02 |
| Home economics |
352 |
4,097 |
4,449 |
11.64 |
389 |
4,011 |
4,400 |
10.31 |
464 |
4,046 |
4,510 |
8.72 |
| 6. Natural sciences |
21,878 |
22,229 |
44,107 |
1.02 |
28,354 |
26,715 |
55,069 |
0.94 |
27,695 |
29,094 |
56,789 |
1.05 |
| Natural sciences |
10,142 |
12,055 |
22,197 |
1.19 |
14,763 |
15,724 |
30,487 |
1.07 |
14,524 |
17,775 |
32,299 |
1.22 |
| Mathematics, statistics and Computer science |
11,736 |
10,174 |
21,910 |
0.87 |
13,591 |
10,991 |
24,582 |
0.81 |
13,171 |
11,319 |
24,490 |
0.86 |
| 7. Medicine and related subjects |
14,484 |
40,849 |
55,333 |
2.82 |
16,232 |
41,761 |
57,993 |
2.57 |
16,945 |
43,164 |
60,109 |
2.55 |
| 8. Engineering |
38,376 |
7,147 |
45,523 |
0.19 |
40,606 |
8,096 |
48,702 |
0.20 |
44,194 |
8,525 |
52,719 |
0.19 |
| Engineering |
36,606 |
6,262 |
42,868 |
0.17 |
38,368 |
7,042 |
45,410 |
0.18 |
41,686 |
7,401 |
49,087 |
0.18 |
| Architecture and town planning |
1,770 |
885 |
2,655 |
0.50 |
2,238 |
1,054 |
3,292 |
0.47 |
2,508 |
1,124 |
3,632 |
0.45 |
| 9. Agriculture, forestry and fishery |
15,311 |
11,249 |
26,560 |
0.73 |
16,191 |
13,037 |
29,228 |
0.81 |
16,367 |
13,782 |
30,149 |
0.84 |
| 10. Not known or unspecified |
1,629 |
1,667 |
3,296 |
1.02 |
477 |
644 |
1,121 |
1.35 |
579 |
870 |
1,449 |
1.50 |
|
|
|
|
|
• |
Ratio of female to male students in selected subjects of tertiary education |
|
|
|
|
| |
| Tertiary education classified by ISCED |
2000 |
2001 |
2002 |
| male(number) |
female(number) |
total(number) |
female/male ratio |
male(number) |
female(number) |
total(number) |
female/male ratio |
male(number) |
female(number) |
total(number) |
female/male ratio |
| Total |
416,025 |
467,048 |
883,073 |
1.12 |
441,586 |
509,929 |
951,515 |
1.15 |
474,516 |
546,417 |
1,020,933 |
1.15 |
| 1. Teacher training and education science |
33,227 |
50,064 |
83,291 |
1.51 |
33,406 |
56,585 |
89,991 |
1.69 |
33,415 |
52,341 |
85,756 |
1.57 |
| 2. Humanities, religion and theology |
7,120 |
24,282 |
31,402 |
3.41 |
7,974 |
27,161 |
35,135 |
3.41 |
9,269 |
30,814 |
40,083 |
3.32 |
| 3. Fine and Applied Arts |
3,366 |
2,537 |
5,903 |
0.75 |
3,487 |
2,664 |
6,151 |
0.76 |
3,674 |
3,016 |
6,690 |
0.82 |
| 4. Law |
87,260 |
34,585 |
121,845 |
0.40 |
92,203 |
41,157 |
133,360 |
0.45 |
100,535 |
48,211 |
148,746 |
0.48 |
| 5. Social sciences and business |
173,833 |
257,108 |
430,941 |
1.48 |
190,071 |
280,840 |
470,911 |
1.48 |
202,735 |
299,590 |
502,325 |
1.48 |
| Social and behavioural science |
100,244 |
82,900 |
183,144 |
0.83 |
112,420 |
93,635 |
206,055 |
0.83 |
121,267 |
117,208 |
238,475 |
0.97 |
| Business and administration |
56,145 |
135,584 |
191,729 |
2.41 |
60,210 |
146,851 |
207,061 |
2.44 |
63,972 |
156,599 |
220,571 |
2.45 |
| Journalism and information |
16,958 |
34,497 |
51,455 |
2.03 |
16,852 |
35,633 |
52,485 |
2.11 |
17,000 |
35,474 |
52,474 |
2.09 |
| Home economics |
486 |
4,127 |
4,613 |
8.49 |
589 |
4,721 |
5,310 |
8.02 |
550 |
4,149 |
4,699 |
7.54 |
| 6. Natural sciences |
29,401 |
30,751 |
60,152 |
1.05 |
31,304 |
32,740 |
64,044 |
1.05 |
32,828 |
35,071 |
67,899 |
1.07 |
| Natural sciences |
15,838 |
19,830 |
35,668 |
1.25 |
16,586 |
20,471 |
37,057 |
1.23 |
16,128 |
21,685 |
37,813 |
1.34 |
| Mathematics, statistics and Computer science |
13,563 |
10,921 |
24,484 |
0.81 |
14,718 |
12,269 |
26,987 |
0.83 |
16,700 |
13,386 |
30,086 |
0.80 |
| 7. Medicine and related subjects |
17,070 |
41,904 |
58,974 |
2.45 |
16,717 |
40,693 |
57,410 |
2.43 |
16,596 |
40,474 |
57,070 |
2.44 |
| 8. Engineering |
46,905 |
9,124 |
56,029 |
0.19 |
47,500 |
9,634 |
57,134 |
0.20 |
50,958 |
10,906 |
61,864 |
0.21 |
| Engineering |
44,036 |
7,856 |
51,892 |
0.18 |
44,394 |
8,273 |
52,667 |
0.19 |
47,787 |
9,459 |
57,246 |
0.20 |
| Architecture and town planning |
2,869 |
1,268 |
4,137 |
0.44 |
3,106 |
1,361 |
4,467 |
0.44 |
3,171 |
1,447 |
4,618 |
0.46 |
| 9. Agriculture, forestry and fishery |
17,206 |
15,653 |
32,859 |
0.91 |
18,280 |
17,433 |
35,713 |
0.95 |
17,917 |
18,697 |
36,614 |
1.04 |
| 10. Not known or unspecified |
637 |
1,040 |
1,677 |
1.63 |
644 |
1,022 |
1,666 |
1.59 |
6,589 |
7,297 |
13,886 |
1.11 |
|
|
| |
|
|
| |
Indicator 2.6 Ratio of Women to Men in ICT Occupations |
|
| |
|
|
| • |
Ratio of women to men in ICT occupations indicates the degree of access and participation of men and women in ICT sector, which is the fast-growing and significant driving force of the economy. |
|
| |
|
|
| |
ICT occupations |
|
| |
|
|
| • |
In 2006, ratio of women to men in ICT occupations was very low at 0.12. In the high-skilled group, largely those in computer and computer-related works, the ratio was 0.51. In the low-skilled group, largely electrical and electronic equipment mechanics and fitters, the ratio was 0.02. |
|
| |
|
|
| • |
ICT occupations by sex, and category of work |
|
| |
|
|
| |
| Category of ICT work |
2003 |
2004 |
| total(number) |
male(number) |
female(number) |
female/male ratio |
total(number) |
male(number) |
female(number) |
female/male ratio |
| Total |
320,048 |
291,172 |
28,875 |
0.10 |
339,615 |
300,906 |
38,709 |
0.13 |
| 1. High skilled ICT - related occupations |
77,529 |
54,153 |
23,376 |
0.43 |
92,102 |
58,022 |
34,079 |
0.59 |
| COMPUTING PROFESSIONALS |
20,241 |
14,057 |
6,183 |
0.44 |
28,996 |
17,973 |
11,023 |
0.61 |
| - Computer systems designers and analysts |
4,724 |
3,089 |
1,635 |
0.53 |
6,419 |
3,808 |
2,611 |
0.69 |
| - Computer programmers |
11,093 |
8,157 |
2,936 |
0.36 |
17,062 |
10,501 |
6,561 |
0.62 |
| - Computing professionals not elsewhere classified |
4,424 |
2,812 |
1,612 |
0.57 |
5,515 |
3,663 |
1,851 |
0.51 |
| COMPUTER ASSOCIATE PROFESSIONALS |
21,795 |
12,220 |
9,575 |
0.78 |
24,949 |
12,523 |
12,426 |
0.99 |
| - Computer assistants |
9,182 |
4,754 |
4,428 |
0.93 |
9,347 |
4,433 |
4,914 |
1.11 |
| - Computer equipment operators |
12,613 |
7,467 |
5,146 |
0.69 |
15,355 |
7,868 |
7,487 |
0.95 |
| - Industrial robot controllers |
- |
- |
- |
- |
247 |
223 |
25 |
0.11 |
| OPTICAL AND ELECTRONIC EQUIPMENT OPERATORS |
35,493 |
27,875 |
7,618 |
0.27 |
38,157 |
27,526 |
10,630 |
0.39 |
| - Photographers and image and sound recording equipment operators |
17,566 |
12,207 |
5,359 |
0.44 |
19,755 |
13,701 |
6,054 |
0.44 |
| - Broadcasting and telecommunications equipment operators |
15,759 |
13,887 |
1,872 |
0.13 |
13,859 |
11,574 |
2,285 |
0.20 |
| - Medical equipment operators |
2,168 |
1,781 |
387 |
0.22 |
4,542 |
2,251 |
2,291 |
1.02 |
| - Optical and electronic equipment operators not elsewhere classification |
- |
- |
- |
- |
- |
- |
- |
- |
| 2. Low skilled ICT occupations |
242,519 |
237,019 |
5,499 |
0.02 |
247,513 |
242,884 |
4,629 |
0.02 |
| ELECTRICAL AND ELECTRONIC EQUIPMENT MECHANICS AND FITTERS |
242,519 |
237,019 |
5,499 |
0.02 |
247,513 |
242,884 |
4,629 |
0.02 |
| - Electrical mechanics and fitters |
148,205 |
145,050 |
3,155 |
0.02 |
160,504 |
158,148 |
2,356 |
0.01 |
| - Electronics fitters |
2,938 |
2,747 |
191 |
0.07 |
3,701 |
3,538 |
163 |
0.05 |
| - Electronics mechanics and servicers |
46,978 |
44,970 |
2,008 |
0.04 |
42,283 |
40,968 |
1,315 |
0.03 |
| - Telegraph and telephone installers and servicers |
20,043 |
19,976 |
68 |
0.00 |
18,810 |
18,161 |
649 |
0.04 |
| - Electrical line installers, repairers and cable jointers |
24,355 |
24,277 |
78 |
0.00 |
22,215 |
22,069 |
147 |
0.66 |
|
|
| |
|
|
| |
| Category of ICT work |
2005 |
2006 |
| total(number) |
male(number) |
female(number) |
female/male ratio |
total(number) |
male(number) |
female(number) |
female/male ratio |
| Total |
348,081 |
307,611 |
40,471 |
0.13 |
359,328 |
320,635 |
38,692 |
0.12 |
| 1. High skilled ICT - related occupations |
103,222 |
67,009 |
36,214 |
0.54 |
99,204 |
65,916 |
33,288 |
0.51 |
| COMPUTING PROFESSIONALS |
34,405 |
19,699 |
14,706 |
0.75 |
30,055 |
20,890 |
9,165 |
0.44 |
| - Computer systems designers and analysts |
7,579 |
3,717 |
3,862 |
1.04 |
6,965 |
5,253 |
1,712 |
0.33 |
| - Computer programmers |
22,647 |
13,338 |
9,309 |
0.70 |
18,509 |
12,555 |
5,954 |
0.47 |
| - Computing professionals not elsewhere classified |
4,179 |
2,644 |
1,534 |
0.58 |
4,581 |
3,082 |
1,499 |
0.49 |
| COMPUTER ASSOCIATE PROFESSIONALS |
30,364 |
17,148 |
13,215 |
0.77 |
33,002 |
17,058 |
15,944 |
0.93 |
| - Computer assistants |
9,741 |
6,934 |
2,807 |
0.40 |
12,050 |
7,372 |
4,679 |
0.63 |
| - Computer equipment operators |
20,573 |
10,215 |
10,359 |
1.01 |
20,864 |
9,599 |
11,265 |
1.17 |
| - Industrial robot controllers |
49 |
- |
49 |
- |
87 |
87 |
- |
- |
| OPTICAL AND ELECTRONIC EQUIPMENT OPERATORS |
38,454 |
30,162 |
8,293 |
0.27 |
36,147 |
27,968 |
8,180 |
0.29 |
| - Photographers and image and sound recording equipment operators |
17,035 |
13,395 |
3,640 |
0.27 |
19,005 |
14,332 |
4,674 |
0.33 |
| - Broadcasting and telecommunications equipment operators |
13,855 |
12,027 |
1,828 |
0.15 |
12,771 |
10,949 |
1,823 |
0.17 |
| - Medical equipment operators |
7,440 |
4,615 |
2,825 |
0.61 |
4,371 |
2,687 |
1,683 |
0.63 |
| - Optical and electronic equipment operators not elsewhere classification |
125 |
125 |
- |
- |
- |
- |
- |
- |
| 2. Low skilled ICT occupations |
244,859 |
240,602 |
4,257 |
0.02 |
260,124 |
254,719 |
5,404 |
0.02 |
| ELECTRICAL AND ELECTRONIC EQUIPMENT MECHANICS AND FITTERS |
244,859 |
240,602 |
4,257 |
0.02 |
260,124 |
254,719 |
5,404 |
0.02 |
| - Electrical mechanics and fitters |
169,003 |
166,587 |
2,416 |
0.01 |
172,738 |
169,378 |
3,360 |
0.02 |
| - Electronics fitters |
2,655 |
2,363 |
292 |
0.12 |
2,019 |
1,873 |
146 |
0.08 |
| - Electronics mechanics and servicers |
43,366 |
42,368 |
997 |
0.02 |
48,269 |
46,741 |
1,528 |
0.03 |
| - Telegraph and telephone installers and servicers |
10,152 |
10,097 |
54 |
0.01 |
13,857 |
13,542 |
315 |
0.02 |
| - Electrical line installers, repairers and cable jointers |
19,685 |
19,187 |
498 |
0.03 |
23,241 |
23,186 |
56 |
0.00 |
|
|
| |
|
|
| |
Indicator 2.7 Computer Literacy Rate among Population 6 Years and over |
|
| |
|
|
| • |
Computer literacy rate shows the level of access to and use of computer by population in various areas of the country. Computer has become a very crucial learning, occupational, and communication tools. Computer illiteracy may be due to the lack of infrastructure (electricity), socio-economic constraints, or the lack of awareness and learning opportunity. |
|
| |
|
|
| |
Computer literacy rate |
|
| |
|
|
| • |
Computer literacy rate among population 6 years and over was only 25.9% in 2006. Men and women had equal access to and use of computer in every region, except for the South where women fared better than men. But the urban-rural gap was noticeably large. |
|
| |
|
|
| • |
Computer literacy rate among population 6 years and over by sex, administrative area, and region |
|
| |
|
|
| |
| Computer literacy rate |
2005 (3rd quarter) |
| population 6 years and over (number) |
population 6 years and over havingused computer (number) |
computer literacy rate(%) |
| total |
male |
female |
total |
male |
female |
total |
male |
female |
| Whole Kingdom |
59,081,233 |
28,911,988 |
30,169,245 |
14,450,070 |
7,080,247 |
7,369,823 |
24.5 |
24.5 |
24.4 |
| municipal area |
17,931,978 |
8,547,775 |
9,384,203 |
6,359,285 |
3,089,715 |
3,269,570 |
35.5 |
36.1 |
34.8 |
| non-municipal area |
41,149,255 |
20,364,213 |
20,785,042 |
8,090,785 |
3,990,532 |
4,100,254 |
19.7 |
19.6 |
19.7 |
| Bangkok Metropolis |
6,297,353 |
2,947,405 |
3,349,948 |
2,446,292 |
1,166,992 |
1,279,299 |
38.8 |
39.6 |
38.2 |
| municipal area |
6,297,353 |
2,947,405 |
3,349,948 |
2,446,292 |
1,166,992 |
1,279,299 |
38.8 |
39.6 |
38.2 |
| Central Region |
14,390,826 |
7,010,951 |
7,379,874 |
3,604,337 |
1,762,749 |
1,841,588 |
25.0 |
25.1 |
25.0 |
| municipal area |
4,709,773 |
2,253,338 |
2,456,435 |
1,495,961 |
746,314 |
749,647 |
31.8 |
33.1 |
30.5 |
| non-municipal area |
9,681,052 |
4,757,613 |
4,923,439 |
2,108,375 |
1,016,435 |
1,091,940 |
21.8 |
21.4 |
22.2 |
| Northern Region |
10,800,537 |
5,299,567 |
5,500,970 |
2,605,373 |
1,288,853 |
1,316,520 |
24.1 |
24.3 |
23.9 |
| municipal area |
2,093,328 |
994,572 |
1,098,755 |
758,167 |
370,665 |
387,501 |
36.2 |
37.3 |
35.3 |
| non-municipal area |
8,707,209 |
4,304,994 |
4,402,214 |
1,847,207 |
918,188 |
929,019 |
21.2 |
21.3 |
21.1 |
| Northeastern Region |
19,742,246 |
9,785,827 |
9,956,420 |
3,907,806 |
1,966,678 |
1,941,128 |
19.8 |
20.1 |
19.5 |
| municipal area |
2,976,896 |
1,451,893 |
1,525,002 |
1,001,819 |
490,513 |
511,306 |
33.7 |
33.8 |
33.5 |
| non-municipal area |
16,765,351 |
8,333,933 |
8,431,417 |
2,905,987 |
1,476,165 |
1,429,822 |
17.3 |
17.7 |
17.0 |
| Southern Region |
7,850,271 |
3,868,238 |
3,982,033 |
1,886,263 |
894,975 |
991,288 |
24.0 |
23.1 |
24.9 |
| municipal area |
1,854,628 |
900,567 |
954,062 |
657,046 |
315,231 |
341,815 |
35.4 |
35.0 |
35.8 |
| non-municipal area |
5,995,643 |
2,967,672 |
3,027,972 |
1,229,216 |
579,744 |
649,472 |
20.5 |
19.5 |
21.4 |
|
|
| |
| Computer literacy rate |
2006 (3rd quarter) |
| population 6 years and over (number) |
population 6 years and over havingused computer (number) |
computer literacy rate(%) |
| total |
male |
female |
total |
male |
female |
total |
male |
female |
| Whole Kingdom |
59,508,623 |
29,107,166 |
30,401,457 |
15,392,496 |
7,529,274 |
7,863,222 |
25.9 |
25.9 |
25.9 |
| municipal area |
18,154,653 |
8,846,597 |
9,508,056 |
6,588,789 |
3,199,547 |
3,389,242 |
36.3 |
36.2 |
35.6 |
| non-municipal area |
41,353,970 |
20,460,570 |
20,893,400 |
8,803,789 |
4,329,727 |
4,473,980 |
21.3 |
21.2 |
21.4 |
| Bangkok Metropolis |
6,345,725 |
2,965,940 |
3,379,785 |
2,516,848 |
1,194,350 |
1,322,498 |
39.7 |
40.3 |
39.1 |
| municipal area |
6,345,725 |
2,965,940 |
3,379,785 |
2,516,848 |
1,194,350 |
1,322,498 |
39.7 |
40.3 |
39.1 |
| Central Region |
14,587,175 |
7,105,655 |
7,481,520 |
3,827,002 |
1879687 |
1,947,315 |
26.2 |
26.5 |
26.0 |
| municipal area |
4,774,438 |
2,281,854 |
2,492,584 |
1,535,949 |
760,032 |
775,917 |
32.2 |
33.3 |
31.1 |
| non-municipal area |
9,812,737 |
4,823,801 |
4,988,936 |
2,291,054 |
1,119,655 |
1,171,399 |
23.3 |
23.2 |
23.5 |
| Northern Region |
10,789,691 |
5,290,717 |
5,498,974 |
2,804,839 |
1,405,548 |
1,399,291 |
26.0 |
26.6 |
25.4 |
| municipal area |
2,094,726 |
993,844 |
1,100,881 |
969,038 |
375,187 |
391,851 |
46.3 |
37.8 |
35.6 |
| non-municipal area |
8,694,965 |
4,296,872 |
4,398,092 |
2,037,801 |
1,030,361 |
1,007,440 |
23.4 |
24.0 |
22.9 |
| Northeastern Region |
19,847,840 |
9,835,736 |
10,012,104 |
4,264,587 |
2,116,363 |
2,148,223 |
21.5 |
21.5 |
21.5 |
| municipal area |
3,069,135 |
1,496,275 |
1,570,860 |
1,094,468 |
544,749 |
549,719 |
35.7 |
36.4 |
35.0 |
| non-municipal area |
16,778,705 |
8,337,460 |
8,441,244 |
3,170,119 |
1,571,614 |
1,598,505 |
18.9 |
18.9 |
18.9 |
| Southern Region |
7,938,192 |
3,909,119 |
4,029,073 |
1,979,220 |
933,326 |
1,045,894 |
24.9 |
23.9 |
26.0 |
| municipal area |
1,870,629 |
906,684 |
963,945 |
674,486 |
325,229 |
349,258 |
36.1 |
35.9 |
36.2 |
| non-municipal area |
6,067,563 |
3,002,436 |
3,065,128 |
1,304,734 |
608,098 |
696,636 |
21.5 |
20.3 |
22.7 |
|
|
| |
|
|
| |
Indicator 2.8 Internet Literacy Rate among Population 6 Years and over |
|
| |
|
|
| • |
Internet literacy rate shows the level of access to and use of internet by population in various areas of the country. Internet has become a very important learning, occupational, and communication tools. Lack of internet access may be due to the lack of infrastructure (telephone lines), socioeconomic constraints, or the lack of awareness and opportunity. |
|
| |
|
|
| |
Internet literacy rate |
|
| |
|
|
| • |
Population 6 years and over having used internet increased from 12% to 14.2% during 2005-2006. Women had higher literacy rate than men in every region except for Bangkok where men’s rate was slightly higher. Urban population had higher literacy rate than rural population. |
|
| |
|
|
| • |
Internet literacy rate among population 6 years and over by sex, administrative area and region |
|
| |
|
|
| |
| Internet literacy rate |
2005 (3rd quarter) |
| population 6 years and over (number) |
population 6 years and over having usedinternet (number) |
internet literacy rate (%) |
| total |
male |
female |
total |
male |
female |
total |
male |
female |
| Whole Kingdom |
59,081,233 |
28,911,988 |
30,169,245 |
7,084,201 |
3,406,118 |
3,678,083 |
12.0 |
11.8 |
12.2 |
| municipal area |
17,931,978 |
8,547,775 |
9,384,203 |
3,807,055 |
1,862,856 |
1,944,199 |
21.2 |
21.8 |
20.7 |
| non-municipal area |
41,149,255 |
20,364,213 |
20,785,042 |
3,277,146 |
1,543,262 |
1,733,884 |
8.0 |
7.6 |
8.3 |
| Bangkok Metropolis |
6,297,353 |
2,947,405 |
3,349,948 |
1,630,752 |
793,428 |
837,324 |
25.9 |
26.9 |
25.0 |
| municipal area |
6,297,353 |
2,947,405 |
3,349,948 |
1,630,752 |
793,428 |
837,324 |
25.9 |
26.9 |
25.0 |
| Central Region |
14,390,826 |
7,010,951 |
7,379,874 |
1,706,396 |
814,471 |
891,925 |
11.9 |
11.6 |
12.1 |
| municipal area |
4,709,773 |
2,253,338 |
2,456,435 |
811,923 |
412,676 |
399,248 |
17.2 |
18.3 |
16.3 |
| non-municipal area |
9,681,052 |
4,757,613 |
4,923,439 |
894,473 |
401,796 |
492,678 |
9.2 |
8.4 |
10.0 |
| Northern Region |
10,800,537 |
5,299,567 |
5,500,970 |
1,285,577 |
650,180 |
635,397 |
11.9 |
12.3 |
11.6 |
| municipal area |
2,093,328 |
994,572 |
1,098,755 |
447,746 |
222,240 |
225,506 |
21.4 |
22.3 |
20.5 |
| non-municipal area |
8,707,209 |
4,304,994 |
4,402,214 |
837,830 |
427,940 |
409,891 |
9.6 |
9.9 |
9.3 |
| Northeastern Region |
19,742,246 |
9,785,827 |
9,956,420 |
1,660,707 |
790,906 |
869,801 |
8.4 |
8.1 |
8.7 |
| municipal area |
2,976,896 |
1,451,893 |
1,525,002 |
569,181 |
275,776 |
293,405 |
19.1 |
19.0 |
19.2 |
| non-municipal area |
16,765,351 |
8,333,933 |
8,431,417 |
1,091,526 |
515,129 |
576,397 |
6.5 |
6.2 |
6.8 |
| Southern Region |
7,850,271 |
3,868,238 |
3,982,033 |
800,769 |
357,133 |
443,636 |
10.2 |
9.2 |
11.1 |
| municipal area |
1,854,628 |
900,567 |
954,062 |
347,453 |
158,736 |
188,717 |
18.7 |
17.6 |
19.8 |
| non-municipal area |
5,995,643 |
2,967,672 |
3,027,972 |
453,316 |
198,397 |
254,919 |
7.6 |
6.7 |
8.4 |
|
|
| |
|
|
| |
| Internet literacy rate |
2006 (3rd quarter) |
| population 6 years and over (number) |
population 6 years and over having usedinternet (number) |
internet literacy rate (%) |
| total |
male |
female |
total |
male |
female |
total |
male |
female |
| Whole Kingdom |
59,508,623 |
29,107,166 |
30,401,457 |
8,465,823 |
4,034,162 |
4,431,661 |
14.2 |
13.9 |
14.6 |
| municipal area |
18,154,653 |
8,846,597 |
9,508,056 |
4,242,901 |
2,046,916 |
2,195,985 |
23.4 |
23.1 |
23.1 |
| non-municipal area |
41,353,970 |
20,460,570 |
20,893,400 |
4,222,921 |
1,987,245 |
2,235,676 |
10.2 |
9.7 |
10.7 |
| Bangkok Metropolis |
6,345,725 |
2,965,940 |
3,379,785 |
1,774,375 |
841,332 |
933,042 |
28.0 |
28.4 |
27.6 |
| municipal area |
6,345,725 |
2,965,940 |
3,379,785 |
1,774,375 |
841,332 |
933,042 |
28.0 |
28.4 |
27.6 |
| Central Region |
14,587,175 |
7,105,655 |
7,481,520 |
2,028,575 |
975,613 |
1,052,962 |
13.9 |
13.7 |
14.1 |
| municipal area |
4,774,438 |
2,281,854 |
2,492,584 |
908,175 |
446,544 |
461,631 |
19.0 |
19.6 |
18.5 |
| non-municipal area |
9,812,737 |
4,823,801 |
4,988,936 |
1,120,400 |
529,069 |
591,330 |
11.4 |
11.0 |
11.9 |
| Northern Region |
10,789,691 |
5,290,717 |
5,498,974 |
1,581,412 |
773,989 |
807,423 |
14.7 |
14.6 |
14.7 |
| municipal area |
2,094,726 |
993,844 |
1,100,881 |
499,214 |
242,204 |
257,010 |
23.8 |
24.4 |
23.3 |
| non-municipal area |
8,694,965 |
4,296,872 |
4,398,092 |
1,082,198 |
531,785 |
550,413 |
12.4 |
12.4 |
12.5 |
| Northeastern Region |
19,847,840 |
9,835,736 |
10,012,104 |
2,103,780 |
1,004,014 |
1,099,766 |
10.6 |
10.2 |
11.0 |
| municipal area |
3,069,135 |
1,496,275 |
1,570,860 |
662,845 |
327,272 |
335,573 |
21.6 |
21.9 |
21.4 |
| non-municipal area |
16,778,705 |
8,337,460 |
8,441,244 |
1,440,936 |
676,743 |
764,193 |
8.6 |
8.1 |
9.1 |
| Southern Region |
7,938,192 |
3,909,119 |
4,029,073 |
977,680 |
439,213 |
538,467 |
12.3 |
11.2 |
13.4 |
| municipal area |
1,870,629 |
906,684 |
963,945 |
398,292 |
189,565 |
208,727 |
21.3 |
20.9 |
21.7 |
| non-municipal area |
6,067,563 |
3,002,436 |
3,065,128 |
579,388 |
249,648 |
329,740 |
9.5 |
8.3 |
10.8 |
|
|
| |
|
|
| |
Indicator 2.9 ICT Literacy Rate among Population 15-25 Years Old |
|
| |
|
|
| • |
Computer Literacy Rate among Population 15-25 Years Old Computer literacy is specially important for the youth as they prepare themselves for higher education or the job market. |
|
| |
|
|
| |
Youth computer literacy |
|
| |
|
|
| • |
Population 15-24 years old having computer skills was 48.9% and 50.4% in 2005 and 2006, respectively. Women posed higher computer literacy rate than men throughout the country. The rate was highest among the Bangkok youth. In the South, more women than men used computer. In every region, computer was more extensively used among urban youth, compared with their rural peers. |
|
| |
|
|
| • |
Computer literacy rate among population 15-24 years old by sex, administrative area, and region |
|
| |
|
|
| |
| Computer literacy rate |
2005 (3rd quarter) |
| Population 15-24 years old (number) |
Population 15-24 years oldhaving used computer (number) |
computer literacy rate (%) |
| male |
female |
total |
male |
female |
total |
male |
female |
total |
| Whole Kingdom |
5,380,611 |
5,197,142 |
10,577,753 |
2,470,733 |
2,699,023 |
5,169,756 |
45.9 |
51.9 |
48.9 |
| municipal area |
1,543,693 |
1,584,842 |
3,128,534 |
884,983 |
1,003,031 |
1,888,014 |
57.3 |
63.3 |
60.3 |
| non-municipal area |
3,836,919 |
3,612,301 |
7,449,219 |
1,585,750 |
1,695,992 |
3,281,742 |
41.3 |
47.0 |
44.1 |
| Bangkok Metropolis |
484,462 |
523,943 |
1,008,405 |
298,727 |
348,566 |
647,293 |
61.7 |
66.5 |
64.2 |
| municipal area |
484,462 |
523,943 |
1,008,405 |
298,727 |
348,566 |
647,293 |
61.7 |
66.5 |
64.2 |
| Central Region |
1,301,257 |
1,254,258 |
2,555,514 |
543,362 |
624,356 |
1,167,718 |
41.8 |
49.8 |
45.7 |
| municipal area |
421,268 |
423,853 |
845,121 |
213,647 |
234,836 |
448,483 |
50.7 |
55.4 |
53.1 |
| non-municipal area |
879,989 |
830,405 |
1,710,394 |
329,715 |
389,520 |
719,235 |
37.5 |
46.9 |
42.1 |
| Northern Region |
920,402 |
896,185 |
1,816,587 |
468,735 |
480,747 |
949,481 |
50.9 |
53.6 |
52.3 |
| municipal area |
171,204 |
177,640 |
348,844 |
114,651 |
120,782 |
235,434 |
67.0 |
68.0 |
67.5 |
| non-municipal area |
749,198 |
718,545 |
1,467,743 |
354,084 |
359,964 |
714,048 |
47.3 |
50.1 |
48.6 |
| Northeastern Region |
1,868,786 |
1,744,504 |
3,613,290 |
830,576 |
849,420 |
1,679,996 |
44.4 |
48.7 |
46.5 |
| municipal area |
279,251 |
271,477 |
550,728 |
160,957 |
178,742 |
339,699 |
57.6 |
65.8 |
61.7 |
| non-municipal area |
1,589,535 |
1,473,027 |
3,062,562 |
669,619 |
670,678 |
1,340,297 |
42.1 |
45.5 |
43.8 |
| Southern Region |
805,705 |
778,253 |
1,583,958 |
329,333 |
395,935 |
725,268 |
40.9 |
50.9 |
45.8 |
| municipal area |
187,508 |
187,929 |
375,437 |
97,000 |
120,105 |
217,105 |
51.7 |
63.9 |
57.8 |
| non-municipal area |
618,197 |
590,324 |
1,208,521 |
232,333 |
275,830 |
508,163 |
37.6 |
46.7 |
42.0 |
|
|
| |
| Computer literacy rate |
2006 (3rd quarter) |
| Population 15-24 years old (number) |
Population 15-24 years oldhaving used computer (number) |
computer literacy rate (%) |
| male |
female |
total |
male |
female |
total |
male |
female |
total |
| Whole Kingdom |
5,373,087 |
5,182,336 |
10,555,423 |
2,549,705 |
2,772,638 |
5,322,342 |
47.5 |
53.5 |
50.4 |
| municipal area |
1,534,922 |
1,570,278 |
3,105,199 |
901,574 |
949,414 |
1,850,989 |
58.7 |
60.5 |
59.6 |
| non-municipal area |
3,838,166 |
3,612,059 |
7,450,224 |
1,648,130 |
1,823,223 |
3,471,354 |
42.9 |
50.5 |
46.6 |
| Bangkok Metropolis |
466,890 |
500,544 |
967,434 |
294,631 |
294,121 |
588,752 |
63.1 |
58.8 |
60.9 |
| municipal area |
466,890 |
500,544 |
967,434 |
294,631 |
294,121 |
588,752 |
63.1 |
58.8 |
60.9 |
| Central Region |
1,302,145 |
1,251,714 |
2,553,858 |
561,888 |
615,031 |
1,176,918 |
43.2 |
49.1 |
46.1 |
| municipal area |
421,676 |
423,795 |
845,471 |
220,239 |
231,486 |
451,725 |
52.2 |
54.6 |
53.4 |
| non-municipal area |
880,469 |
827,919 |
1,708,388 |
341,649 |
383,544 |
725,193 |
38.8 |
46.3 |
42.4 |
| Northern Region |
919,682 |
894,969 |
1,814,651 |
503,271 |
524,867 |
1,028,138 |
54.7 |
58.6 |
56.7 |
| municipal area |
171,139 |
177,711 |
348,850 |
113,038 |
123,982 |
237,019 |
66.1 |
69.8 |
67.9 |
| non-municipal area |
748,543 |
717,258 |
1,465,801 |
390,233 |
400,885 |
791,119 |
52.1 |
55.9 |
54.0 |
| Northeastern Region |
1,873,627 |
1,752,837 |
3,626,464 |
861,754 |
917,014 |
1,778,768 |
46.0 |
52.3 |
49.0 |
| municipal area |
287,256 |
279,647 |
566,903 |
179,205 |
184,247 |
363,452 |
62.4 |
65.9 |
64.1 |
| non-municipal area |
1,586,371 |
1,473,190 |
3,059,561 |
682,549 |
732,768 |
1,415,316 |
43.0 |
49.7 |
46.3 |
| Southern Region |
810,744 |
782,273 |
1,593,017 |
328,161 |
421,604 |
749,765 |
40.5 |
53.9 |
47.1 |
| municipal area |
187,961 |
188,581 |
376,542 |
94,461 |
115,579 |
210,040 |
50.3 |
61.3 |
55.8 |
| non-municipal area |
622,783 |
593,692 |
1,216,475 |
233,700 |
306,026 |
539,725 |
37.5 |
51.5 |
44.4 |
|
|
| |
|
|
| |
Internet Literacy Rate among Population 15-24 Years Old |
|
| |
|
|
| • |
Internet literacy is specially important for the youth as they prepare themselves for higher education or the job market. |
|
| |
|
|
| |
Youth internet literacy |
|
| |
|
|
| • |
Internet literacy among population 15-24 years old increased from 31.3% to 36.5% during 20052006. Women had higher internet literacy rate than men in every region, except for Bangkok. The urban-rural gap cut across the regions. |
|
| |
|
|
| • |
Internet literacy rate among population 15-24 years old by sex, administrative area, and region 2) Internet literacy rate among population 15-24 years old by sex, administrative area, and region |
|
| |
|
|
| |
| 1) Internet literacy rate |
2005 (3rd quarter) |
| Population 15-24 years old (number) |
Population 15-24 years oldhaving used internet (number) |
internet literacy rate(%) |
| male |
female |
total |
male |
female |
total |
male |
female |
total |
| Whole Kingdom |
5,380,611 |
5,197,142 |
10,577,753 |
1,527,591 |
1,786,009 |
3,313,600 |
28.4 |
34.4 |
31.3 |
| municipal area |
1,543,693 |
1,584,842 |
3,128,534 |
658,540 |
758,177 |
1,416,717 |
42.7 |
47.8 |
45.3 |
| non-municipal area |
3,836,919 |
3,612,301 |
7,449,219 |
869,051 |
1,027,832 |
1,896,883 |
22.6 |
28.5 |
25.5 |
| Bangkok Metropolis |
484,462 |
523,943 |
1,008,405 |
241,134 |
278,737 |
519,871 |
49.8 |
53.2 |
51.6 |
| municipal area |
484,462 |
523,943 |
1,008,405 |
241,134 |
278,737 |
519,871 |
49.8 |
53.2 |
51.6 |
| Central Region |
1,301,257 |
1,254,258 |
2,555,514 |
317,380 |
409,081 |
726,461 |
24.4 |
32.6 |
28.4 |
| municipal area |
421,268 |
423,853 |
845,121 |
145,271 |
160,661 |
305,932 |
34.5 |
37.9 |
36.2 |
| non-municipal area |
879,989 |
830,405 |
1,710,394 |
172,110 |
248,419 |
420,529 |
19.6 |
29.9 |
24.6 |
| Northern Region |
920,402 |
896,185 |
1,816,587 |
350,115 |
339,883 |
689,998 |
38.0 |
37.9 |
38.0 |
| municipal area |
171,204 |
177,640 |
348,844 |
94,638 |
95,637 |
190,275 |
55.3 |
53.8 |
54.5 |
| non-municipal area |
749,198 |
718,545 |
1,467,743 |
255,477 |
244,246 |
499,723 |
34.1 |
34.0 |
34.0 |
| Northeastern Region |
1,868,786 |
1,744,504 |
3,613,290 |
452,994 |
523,075 |
976,069 |
24.2 |
30.0 |
27.0 |
| municipal area |
279,251 |
271,477 |
550,728 |
119,751 |
136,480 |
256,230 |
42.9 |
50.3 |
46.5 |
| non-municipal area |
1,589,535 |
1,473,027 |
3,062,562 |
333,244 |
386,595 |
719,839 |
21.0 |
26.2 |
23.5 |
| Southern Region |
805,705 |
778,253 |
1,583,958 |
165,967 |
235,234 |
401,200 |
20.6 |
30.2 |
25.3 |
| municipal area |
187,508 |
187,929 |
375,437 |
57,746 |
86,662 |
144,408 |
30.8 |
46.1 |
38.5 |
| non-municipal area |
618,197 |
590,324 |
1,208,521 |
108,221 |
148,572 |
256,793 |
17.5 |
25.2 |
21.2 |
|
|
| |
| 1) Internet literacy rate |
2006 (3rd quarter) |
| Population 15-24 years old (number) |
Population 15-24 years oldhaving used internet (number) |
internet literacyrate (%) |
| male |
female |
total |
male |
female |
total |
male |
female |
total |
| Whole Kingdom |
5,373,087 |
5,182,336 |
10,555,423 |
1,803,104 |
2,050,471 |
3,853,575 |
33.6 |
39.6 |
36.5 |
| municipal area |
1,534,922 |
1,570,278 |
3,105,199 |
722,687 |
759,297 |
1,481,984 |
47.1 |
48.4 |
47.7 |
| non-municipal area |
3,838,166 |
3,612,059 |
7,450,224 |
1,080,417 |
1,291,173 |
2,371,590 |
28.1 |
35.7 |
31.8 |
| Bangkok Metropolis |
466,890 |
500,544 |
967,434 |
241,335 |
245,780 |
487,114 |
51.7 |
49.1 |
50.4 |
| municipal area |
466,890 |
500,544 |
967,434 |
241,335 |
245,780 |
487,114 |
51.7 |
49.1 |
50.4 |
| Central Region |
1,302,145 |
1,251,714 |
2,553,858 |
384,215 |
430,053 |
814,268 |
29.5 |
34.4 |
31.9 |
| municipal area |
421,676 |
423,795 |
845,471 |
166,547 |
173,574 |
340,121 |
39.5 |
41.0 |
40.2 |
| non-municipal area |
880,469 |
827,919 |
1,708,388 |
217,668 |
256,478 |
474,146 |
24.7 |
31.0 |
27.8 |
| Northern Region |
919,682 |
894,969 |
1,814,651 |
408,996 |
433,953 |
842,949 |
44.5 |
48.5 |
46.5 |
| municipal area |
171,139 |
177,711 |
348,850 |
98,653 |
107,320 |
205,973 |
57.6 |
60.4 |
59.0 |
| non-municipal area |
748,543 |
717,258 |
1,465,801 |
310,343 |
326,633 |
636,977 |
41.5 |
45.5 |
43.5 |
| Northeastern Region |
1,873,627 |
1,752,837 |
3,626,464 |
559,609 |
647,448 |
1,207,057 |
29.9 |
36.9 |
33.3 |
| municipal area |
287,256 |
279,647 |
566,903 |
139,593 |
144,097 |
283,690 |
48.6 |
51.5 |
50.0 |
| non-municipal area |
1,586,371 |
1,473,190 |
3,059,561 |
420,016 |
503,351 |
923,368 |
26.5 |
34.2 |
30.2 |
| Southern Region |
810,744 |
782,273 |
1,593,017 |
208,949 |
293,237 |
502,186 |
25.8 |
37.5 |
31.5 |
| municipal area |
187,961 |
188,581 |
376,542 |
76,560 |
88,527 |
165,087 |
40.7 |
46.9 |
43.8 |
| non-municipal area |
622,783 |
593,692 |
1,216,475 |
132,389 |
204,710 |
337,100 |
21.3 |
34.5 |
27.7 |
|
|
| |
|
|
| |
Indicator 2.10 Literacy Rate among Population 15-24 Years Old |
|
| |
|
|
| • |
Literacy rate among population 15-24 years old indicates the potential for learning and self-development of the youth as they are becoming an important part of the national workforce. |
|
| |
|
|
| |
Youth literacy rate |
|
| |
|
|
| • |
Literacy rate of population 15-24 years old was very high at 98.1% In general, women’s rate was slightly behind men’s, but the gap was minuscule. There was no significant difference between urban and rural population. The North was, however, lagging behind other regions, and the gender gap was largest there. On the contrary, Southern women had higher literacy rate than men. |
|
| |
|
|
| • |
Literacy rate among population 15-24 years old by sex, administrative area, and region |
|
| |
|
|
| |
| Literacy rate |
2000 |
2005 |
| total |
male |
female |
total |
male |
female |
| population15-24 yearsold (inthousands) |
literate |
population15-24 yearsold (inthousands) |
literate |
population15-24 yearsold (inthousands) |
literate |
population15-24 yearsold (inthousands) |
literate |
population15-24 yearsold (inthousands) |
literate |
population15-24 yearsold (inthousands) |
literate |
| number (inthousands) |
Literacyrate(%) |
number (inthousands) |
Literacyrate(%) |
number (inthousands) |
Literacyrate(%) |
number (inthousands) |
Literacyrate(%) |
number (inthousands) |
Literacyrate(%) |
number (inthousands) |
Literacyrate(%) |
| Whole Kingdom |
10,549.2 |
10,334.9 |
98.0 |
5,336.3 |
5,234.5 |
98.1 |
5,212.9 |
5,100.4 |
97.8 |
10,568.9 |
10,362.9 |
98.1 |
5,379.4 |
5,283.5 |
98.2 |
5,189.5 |
5,079.4 |
97.9 |
| municipal area |
3,539.0 |
3,496.3 |
98.8 |
1,718.9 |
1,698.6 |
98.8 |
1,820.1 |
1,797.7 |
98.8 |
3,129.3 |
3,084.3 |
98.6 |
1,544.5 |
1,524.5 |
98.7 |
1,584.8 |
1,559.7 |
98.4 |
| non-municipal area |
7,010.2 |
6,838.5 |
97.6 |
3,617.4 |
3,535.9 |
97.7 |
3,392.8 |
3,302.6 |
97.3 |
7,439.6 |
7,278.6 |
97.8 |
3,834.9 |
3,759.0 |
98.0 |
3,604.6 |
3,519.6 |
97.6 |
| Bangkok Metropolis |
1,297.3 |
1,287.9 |
99.3 |
615.2 |
610.9 |
99.3 |
682.1 |
677.0 |
99.2 |
1,012.0 |
1,000.1 |
98.8 |
486.0 |
482.1 |
99.2 |
526.0 |
517.8 |
98.4 |
| municipal area |
1,297.3 |
1,287.9 |
99.3 |
615.2 |
610.9 |
99.3 |
682.1 |
677.0 |
99.2 |
1,012.0 |
1,000.1 |
98.8 |
486.0 |
482.1 |
99.2 |
526.0 |
517.8 |
98.4 |
| Central Region |
2,519.6 |
2,480.9 |
98.5 |
1,268.9 |
1,250.3 |
98.5 |
1,250.7 |
1,230.6 |
98.4 |
2,555.8 |
2,527.6 |
98.9 |
1,301.3 |
1,290.7 |
99.2 |
1,254.6 |
1,236.7 |
98.6 |
| municipal area |
917.7 |
904.5 |
98.6 |
444.9 |
438.6 |
98.6 |
472.8 |
465.9 |
98.5 |
844.9 |
834.0 |
98.7 |
421.1 |
416.6 |
98.9 |
423.8 |
417.5 |
98.5 |
| non-municipal area |
1,601.9 |
1,576.4 |
98.4 |
824.0 |
811.7 |
98.5 |
777.9 |
764.7 |
98.3 |
1,710.9 |
1,693.6 |
99.0 |
880.1 |
874.2 |
99.3 |
830.8 |
819.3 |
98.6 |
| Northern Region |
1,771.1 |
1,675.3 |
94.6 |
905.3 |
862.3 |
95.2 |
865.9 |
813.1 |
93.9 |
1,805.7 |
1,734.4 |
96.1 |
918.5 |
889.1 |
96.8 |
887.2 |
845.4 |
95.3 |
| municipal area |
379.3 |
370.6 |
97.7 |
189.9 |
185.9 |
97.9 |
189.4 |
184.7 |
97.5 |
346.7 |
339.0 |
97.8 |
170.9 |
167.6 |
98.1 |
175.9 |
171.4 |
97.4 |
| non-municipal area |
1,391.8 |
1,304.7 |
93.7 |
715.3 |
676.3 |
94.5 |
676.5 |
628.4 |
92.9 |
1,459.0 |
1,395.3 |
95.6 |
747.7 |
721.5 |
96.5 |
711.3 |
674.0 |
94.8 |
| Northeastern Region |
3,494.4 |
3,460.0 |
99.0 |
1,805.3 |
1,787.9 |
99.0 |
1,689.1 |
1,672.1 |
99.0 |
3,612.3 |
3,551.7 |
98.3 |
1,868.4 |
1,834.3 |
98.2 |
1,743.9 |
1,717.4 |
98.5 |
| municipal area |
609.5 |
604.8 |
99.2 |
305.9 |
303.5 |
99.2 |
303.6 |
301.3 |
99.2 |
550.5 |
544.1 |
98.8 |
279.1 |
274.9 |
98.5 |
271.3 |
269.2 |
99.2 |
| non-municipal area |
2,884.9 |
2,855.3 |
99.0 |
1,499.5 |
1,484.4 |
99.0 |
1,385.4 |
1,370.9 |
98.9 |
3,061.7 |
3,007.6 |
98.2 |
1,589.3 |
1,559.4 |
98.1 |
1,472.6 |
1,448.2 |
98.3 |
| Southern Region |
1,466.8 |
1,430.6 |
97.5 |
741.6 |
723.1 |
97.5 |
725.2 |
707.5 |
97.6 |
1,583.2 |
1,549.2 |
97.9 |
805.3 |
787.1 |
97.7 |
777.9 |
762.1 |
98.0 |
| municipal area |
335.2 |
328.6 |
98.0 |
163.0 |
159.7 |
97.9 |
172.1 |
168.9 |
98.1 |
375.3 |
367.2 |
97.8 |
187.4 |
183.3 |
97.8 |
187.9 |
183.9 |
97.9 |
| non-municipal area |
1,131.6 |
1,102.1 |
97.4 |
578.6 |
563.4 |
97.4 |
553.1 |
538.6 |
97.4 |
1,207.9 |
1,182.0 |
97.9 |
617.9 |
603.9 |
97.7 |
590.2 |
578.1 |
97.9 |
|
|
| |
|
|
| |
Indicator 2.11 Literacy Rate among Population 40 Years and over |
|
| |
|
|
| • |
Thais, especially the youth, have attained high literacy rate, as a result of the expansion of mandatory education and non-formal education to reach out to those who did not attend school during their childhood. Still, some population groups especially those over 40 years old may not be able to overcome the barriers, and have to face formidable challenges in self-improvement, working, taking care of one’s family, and entering into contractual agreements. |
|
| |
|
|
| |
Literacy rate among population 40 years and over |
|
| |
|
|
| • |
Population 40 years and over had 88.7% literacy rate. The rate was relatively low in the North and the South. The gender gap was more prominent than the urban-rural gap, and the largest gap was in the North and the South. |
|
| |
|
|
| • |
Literacy rate among population 40 years old and over by sex, administrative area, and region |
|
| |
|
|
| |
| Literacy rate |
2000 |
2005 |
| total |
male |
female |
total |
male |
female |
| population40 years andover (inthousands) |
literate |
|
population40 years andover (inthousands) |
literate |
|
population40 years andover (inthousands) |
literate |
|
population40 years andover (inthousands) |
literate |
|
population40 years andover (inthousands) |
literate |
|
population40 years andover (inthousands) |
literate |
|
|
| number (inthousands) |
Literacyrate(%) |
number (inthousands) |
Literacyrate(%) |
number (inthousands) |
Literacyrate(%) |
number (inthousands) |
Literacyrate(%) |
number (inthousands) |
Literacyrate(%) |
number (inthousands) |
Literacyrate(%) |
| Whole Kingdom |
19,330.3 |
16,732.5 |
86.6 |
9,179.8 |
8,371.8 |
91.2 |
10,150.4 |
8,360.7 |
82.4 |
22,943.6 |
20,360.7 |
88.7 |
10,822.7 |
10,036.2 |
92.7 |
12,120.9 |
10,324.5 |
85.2 |
| municipal area |
6,051.8 |
5,475.5 |
90.5 |
2,810.3 |
2,646.0 |
94.2 |
3,241.6 |
2,829.5 |
87.3 |
6,837.5 |
6,368.4 |
93.1 |
3,145.0 |
3,016.3 |
95.9 |
3,692.5 |
3,352.0 |
90.8 |
| non-municipal area |
13,278.4 |
11,257.0 |
84.8 |
6,369.6 |
5,725.8 |
89.9 |
6,908.9 |
5,531.2 |
80.1 |
16,106.0 |
13,992.3 |
86.9 |
7,677.6 |
7,019.9 |
91.4 |
8,428.4 |
6,972.4 |
82.7 |
| Bangkok Metropolis |
1,940.2 |
1,774.8 |
91.5 |
889.8 |
844.2 |
94.9 |
1,050.4 |
930.6 |
88.6 |
2,400.0 |
2,280.2 |
95.0 |
1,086.0 |
1,055.1 |
97.2 |
1,314.0 |
1,225.1 |
93.2 |
| municipal area |
1,940.2 |
1,774.8 |
91.5 |
889.8 |
844.2 |
94.9 |
1,050.4 |
930.6 |
88.6 |
2,400.0 |
2,280.2 |
95.0 |
1,086.0 |
1,055.1 |
97.2 |
1,314.0 |
1,225.1 |
93.2 |
| Central Region |
4,546.0 |
4,034.3 |
88.7 |
2,131.0 |
2,000.7 |
93.9 |
2,415.0 |
2,033.6 |
84.2 |
5,434.6 |
4,945.2 |
91.0 |
2,523.5 |
2,401.3 |
95.2 |
2,911.1 |
2,544.0 |
87.4 |
| municipal area |
1,521.9 |
1,388.5 |
91.2 |
703.9 |
669.4 |
95.1 |
818.1 |
719.0 |
87.9 |
1,719.6 |
1,606.7 |
93.4 |
787.1 |
758.5 |
96.4 |
932.5 |
848.1 |
90.9 |
| non-municipal area |
3,024.1 |
2,645.8 |
87.5 |
1,427.1 |
1,331.2 |
93.3 |
1,597.0 |
1,314.6 |
82.3 |
3,714.9 |
3,338.7 |
89.9 |
1,736.4 |
1,642.8 |
94.6 |
1,978.7 |
1,695.9 |
85.7 |
| Northern Region |
4,085.9 |
3,218.2 |
78.8 |
1,972.5 |
1,671.3 |
84.7 |
2,113.4 |
1,546.9 |
73.2 |
4,735.6 |
3,918.2 |
82.7 |
2,278.7 |
2,006.1 |
88.0 |
2,456.9 |
1,912.1 |
77.8 |
| municipal area |
906.2 |
781.6 |
86.2 |
421.9 |
384.1 |
91.0 |
484.3 |
397.5 |
82.1 |
927.3 |
829.1 |
89.4 |
431.8 |
401.6 |
93.0 |
495.4 |
427.5 |
86.3 |
| non-municipal area |
3,179.7 |
2,436.6 |
76.6 |
1,550.6 |
1,287.2 |
83.0 |
1,629.1 |
1,149.4 |
70.6 |
3,808.3 |
3,089.1 |
81.1 |
1,846.9 |
1,604.5 |
86.9 |
1,961.4 |
1,484.5 |
75.7 |
| Northeastern Region |
6,408.4 |
5,793.5 |
90.4 |
3,058.8 |
2,877.1 |
94.1 |
3,349.6 |
2,916.5 |
87.1 |
7,584.8 |
6,825.5 |
90.0 |
3,611.2 |
3,380.3 |
93.6 |
3,973.7 |
3,445.3 |
86.7 |
| municipal area |
1,117.5 |
1,038.4 |
92.9 |
526.5 |
504.2 |
95.8 |
591.0 |
534.2 |
90.4 |
1,135.0 |
1,060.7 |
93.5 |
532.6 |
511.6 |
96.1 |
602.4 |
549.1 |
91.2 |
| non-municipal area |
5,290.8 |
4,755.1 |
89.9 |
2,532.3 |
2,372.9 |
93.7 |
2,758.5 |
2,382.3 |
86.4 |
6,449.8 |
5,764.8 |
89.4 |
3,078.6 |
2,868.7 |
93.2 |
3,371.2 |
2,896.1 |
85.9 |
| Southern Region |
2,349.8 |
1,911.6 |
81.4 |
1,127.7 |
978.5 |
86.8 |
1,222.1 |
933.1 |
76.4 |
2,788.6 |
2,391.6 |
85.8 |
1,323.3 |
1,193.5 |
90.2 |
1,465.3 |
1,198.0 |
81.8 |
| municipal area |
566.0 |
492.2 |
87.0 |
268.1 |
244.0 |
91.0 |
297.8 |
248.2 |
83.3 |
655.7 |
591.8 |
90.3 |
307.3 |
289.5 |
94.2 |
348.2 |
302.3 |
86.8 |
| non-municipal area |
1,783.8 |
1,419.4 |
79.6 |
859.6 |
734.5 |
85.4 |
924.2 |
684.9 |
74.1 |
2,132.9 |
1,799.7 |
84.4 |
1,015.9 |
903.9 |
89.0 |
1,117.1 |
895.7 |
80.2 |
|
|
| |
|
|
| |
Indicator 2.12 Literacy Rate among Population 15 years and over |
|
| |
|
|
| • |
This is commonly referred to as literacy of the workforce – one of the basic indicators of the quality of the workforce. |
|
| |
|
|
| |
Literacy rate of population 15 years and over |
|
| |
|
|
| • |
Bangkok recorded the highest literacy rate among population 15 years and over, while the North came last. Men fared better than women in all regions. The largest gender gap was observed in the North. |
|
| |
|
|
| • |
Literacy rate among population 15 years and over by sex, administrative area, and region |
|
| |
|
|
| |
| Literacy rate amongpopulation 15 years andover |
2000 |
2005 |
| total |
male |
female |
total |
male |
female |
| population15 yearsand over (inthousands) |
literate |
|
population15 yearsand over (inthousands) |
literate |
|
population15 yearsand over (inthousands) |
literate |
|
population15 yearsand over (inthousands) |
literate |
|
population15 yearsand over (inthousands) |
literate |
|
population15 yearsand over (inthousands) |
literate |
|
| number (inthousands) |
Literacyrate(%) |
number (inthousands) |
Literacyrate(%) |
number (inthousands) |
Literacyrate(%) |
number (inthousands) |
Literacyrate(%) |
Literacyrate(%) |
number (inthousands) |
Literacyrate(%) |
number (inthousands) |
| Whole Kingdom |
46,072.5 |
42,679.7 |
92.6 |
22,382.2 |
21,238.7 |
94.9 |
23,690.4 |
21,440.9 |
90.5 |
49,890.7 |
46,651.1 |
93.5 |
24,229.2 |
23,163.2 |
95.6 |
25,661.5 |
23,487.9 |
91.5 |
| municipal area |
15,099.5 |
14,371.0 |
95.2 |
7,142.7 |
6,914.6 |
96.8 |
7,956.9 |
7,456.4 |
93.7 |
15,494.8 |
14,895.5 |
96.1 |
7,320.9 |
7,137.9 |
97.5 |
8,174.0 |
7,757.5 |
94.9 |
| non-municipal area |
30,973.0 |
28,308.7 |
91.4 |
15,239.5 |
14,324.1 |
94.0 |
15,733.5 |
13,984.6 |
88.9 |
34,395.9 |
31,755.6 |
92.3 |
16,908.3 |
16,025.2 |
94.8 |
17,488 |
15,730 |
90.0 |
| Bangkok Metropolis |
5,242.1 |
5,040.6 |
96.2 |
2,442.6 |
2,382.9 |
97.6 |
2,799.5 |
2,657.7 |
94.9 |
5,630.0 |
5,473.2 |
97.2 |
2,606.0 |
2,561.0 |
98.3 |
3,024.0 |
2,912 |
96.3 |
| municipal area |
5,242.1 |
5,040.6 |
96.2 |
2,442.6 |
2,382.9 |
97.6 |
2,799.5 |
2,657.7 |
94.9 |
5,630.0 |
5,473.2 |
97.2 |
2,606.0 |
2,561.0 |
98.3 |
3,024.0 |
2,912 |
96.3 |
| Central Region |
11,057.4 |
10,399.4 |
94.0 |
5,334.1 |
5,145.7 |
96.5 |
5,723.4 |
5,253.7 |
91.8 |
12,425.9 |
11,817.8 |
95.1 |
6,003.6 |
5,837.6 |
97.2 |
6,422.4 |
5,980.1 |
93.1 |
| municipal area |
3,922.7 |
3,745.4 |
95.5 |
1,861.7 |
1,809.2 |
97.2 |
2,060.9 |
1,936.3 |
94.0 |
4,103.7 |
3,957.3 |
96.4 |
1,948.0 |
1,907.6 |
97.9 |
2,155.6 |
2,049.8 |
95.1 |
| non-municipal area |
7,134.8 |
6,654.0 |
93.3 |
3,472.4 |
3,336.6 |
96.1 |
3,662.4 |
3,317.4 |
90.6 |
8,322.2 |
7,860.7 |
94.5 |
4,055.5 |
3,930.1 |
96.9 |
4,266.9 |
3,930.5 |
92.1 |
| Northern Region |
8,754.9 |
7,541.8 |
86.1 |
4,287.2 |
3,839.7 |
89.6 |
4,467.7 |
3,702.1 |
82.9 |
9,082.1 |
8,024.7 |
88.4 |
4,450.5 |
4,078.4 |
91.6 |
4,631.6 |
3,946.5 |
85.2 |
| municipal area |
1,880.8 |
1,725.3 |
91.7 |
894.3 |
843.2 |
94.3 |
986.5 |
882.2 |
89.4 |
1,765.8 |
1,644.4 |
93.1 |
837.4 |
797.1 |
95.2 |
928.3 |
847.4 |
91.3 |
| non-municipal area |
6,874.2 |
5,816.5 |
84.6 |
3,392.9 |
2,996.6 |
88.3 |
3,481.2 |
2,819.9 |
81.0 |
7,316.4 |
6,380.2 |
87.2 |
3,613.2 |
3,281.3 |
90.8 |
3,703.1 |
3,099.0 |
83.7 |
| Northeastern Region |
15,183.7 |
14,424.7 |
95.0 |
7,461.6 |
7,218.5 |
96.7 |
7,722.0 |
7,206.2 |
93.3 |
16,267.0 |
15,341.9 |
94.3 |
8,002.6 |
7,693.3 |
96.1 |
8,264.6 |
7,648.7 |
92.5 |
| municipal area |
2,652.9 |
2,554.4 |
96.3 |
1,278.1 |
1,247.3 |
97.6 |
1,374.9 |
1,307.0 |
95.1 |
2,457.1 |
2,364.5 |
96.2 |
1,189.2 |
1,159.6 |
97.5 |
1,267.7 |
1,204.9 |
95.0 |
| non-municipal area |
12,530.8 |
11,870.3 |
94.7 |
6,183.6 |
5,971.2 |
96.6 |
6,347.2 |
5,899.2 |
92.9 |
13,810.0 |
12,977.5 |
94.0 |
6,813.2 |
6,533.8 |
95.9 |
6,997.0 |
6,443.7 |
92.1 |
| Southern Region |
5,834.4 |
5,273.1 |
90.4 |
2,856.7 |
2,651.8 |
92.8 |
2,977.8 |
2,621.3 |
88.0 |
6,485.7 |
5,993.5 |
92.4 |
3,166.6 |
2,992.8 |
94.5 |
3,319.1 |
3,000.7 |
90.4 |
| municipal area |
1,401.1 |
1,305.2 |
93.2 |
666.0 |
632.0 |
94.9 |
735.1 |
673.2 |
91.6 |
1,538.5 |
1,456.2 |
94.7 |
740.0 |
712.7 |
96.3 |
798.3 |
743.6 |
93.1 |
| non-municipal area |
4,433.3 |
3,967.9 |
89.5 |
2,190.6 |
2,019.8 |
92.2 |
2,242.7 |
1,948.1 |
86.9 |
4,947.2 |
4,537.2 |
91.7 |
2,426.6 |
2,280.1 |
94.0 |
2,520.9 |
2,256.9 |
89.5 |
|
|
| |
|
|
| |
Indicator 2.13 Ratio of Women to Men in Occupational Training |
|
| |
|
|
| |
Occupational training |
|
| |
|
|
| • |
Ratio of women to men in the Ministry of Labour’s job training and skills development training increased from 0.72 in 2002 to 0.94 in 2006. The increase was most outstanding in the North and the Northeast. The number of women participating in training organized by the Ministry of Social Development and Human Security’s Protection and Occupation Centers increased during 20022004, but declined in 2005. |
|
| |
|
|
| • |
Participants in occupational training by sex, and region |
|
| |
|
|
| |
| Participants inoccupatonal training |
2002 |
female/maleratio |
2003 |
female/maleratio |
2004 |
female/maleratio |
2005 |
female/maleratio |
2006 |
female/maleratio |
| total |
male |
female |
total |
male |
female |
total |
male |
female |
total |
male |
female |
total |
male |
female |
| Participants inoccupatonal trainingorganized by Ministry ofLabour |
161,348 |
93,970 |
67,378 |
0.72 |
188,404 |
111,362 |
77,042 |
0.69 |
195,501 |
113,301 |
82,200 |
0.73 |
113,098 |
61,213 |
51,885 |
0.85 |
103,846 |
53,635 |
50,211 |
0.94 |
| Bangkok Metropolis |
1,575 |
1,199 |
376 |
0.31 |
3,241 |
2,606 |
635 |
0.24 |
2,119 |
1,524 |
595 |
0.39 |
1,716 |
1,395 |
321 |
0.23 |
1,373 |
906 |
467 |
0.52 |
| Central Region |
46,643 |
27,571 |
19,072 |
0.69 |
52,164 |
31,980 |
20,184 |
0.63 |
57,418 |
35,612 |
21,806 |
0.61 |
30,921 |
20,605 |
10,316 |
0.50 |
30,006 |
18,320 |
11,686 |
0.64 |
| Northern Region |
41,493 |
24,658 |
16,835 |
0.68 |
48,963 |
29,089 |
19,874 |
0.68 |
48,080 |
28,576 |
19,504 |
0.68 |
29,684 |
14,918 |
14,766 |
0.99 |
22,929 |
10,523 |
12,406 |
1.18 |
| Northeastern Region |
46,956 |
28,287 |
18,669 |
0.66 |
56,246 |
33,048 |
23,198 |
0.70 |
57,731 |
31,957 |
25,774 |
0.81 |
27,708 |
14,706 |
13,002 |
0.88 |
28,382 |
14,132 |
14,250 |
1.01 |
| Southern Region |
24,681 |
12,255 |
12,426 |
1.01 |
27,790 |
14,639 |
13,151 |
0.90 |
30,153 |
15,632 |
14,521 |
0.93 |
23,069 |
9,589 |
13,480 |
1.41 |
21,156 |
9,754 |
11,402 |
1.17 |
| Participants inoccupational training inMinistry of SocialDevelopment and HumanSecurity's Protection andOccupation Centers |
n.a. |
n.a. |
7,567 |
n.a. |
n.a. |
n.a. |
5,936 |
n.a. |
n.a. |
n.a. |
8,275 |
n.a. |
n.a. |
n.a. |
8,730 |
n.a. |
n.a. |
n.a. |
n.a. |
n.a. |
| Total |
n.a. |
n.a. |
74,945 |
n.a. |
n.a. |
n.a. |
82,978 |
n.a. |
n.a. |
n.a. |
90,475 |
n.a. |
n.a. |
n.a. |
60,615 |
n.a. |
n.a. |
n.a. |
n.a. |
n.a. |
|
|
| |
|
|
| |
Indicator 2.14 Proportion of Population 6 Years and over with Reading Habit |
|
| |
|
|
| • |
Reading is very important for life-long learning, and is the fundamental basis for self-development for all population groups. Population with reading habit is a prerequisite for a knowledge-based society. |
|
| |
|
|
| |
Reading habit among population 6 years and over |
|
| |
|
|
| • |
Among the 59.2 million population aged 6 years and over, 40.9 millions or 69.1% were readers. 71.6% of men read, compared with 66.7% among women. In the 6-29 years old age group, women read more or as much as men. But after the age of 30, men surpassed women in both urban and rural areas. |
|
| |
|
|
| • |
Population 6 years and over with reading habit by sex, age group, and administrative area, 2005 Population 6 years and over with reading habit by sex, age group, and administrative area, 2005 |
|
| |
|
|
| |
| Age group/administrative area |
Population 6 years and over (number) |
Population 6 years and over with reading habit (number) |
population with reading habit (%) |
| male |
female |
total |
male |
female |
total |
male |
female |
total |
| total |
29,419.2 |
29,760.2 |
59,179.4 |
21,056.0 |
19,860.3 |
40,916.3 |
71.6 |
66.7 |
69.1 |
| 6 - 9 |
2,122.7 |
2,070.9 |
4,193.6 |
1,636.5 |
1,638.0 |
3,274.6 |
77.1 |
79.1 |
78.1 |
| 10 - 14 |
2,729.0 |
2,667.8 |
5,396.8 |
2,573.2 |
2,562.6 |
5,135.9 |
94.3 |
96.1 |
95.2 |
| 15 - 19 |
2,802.0 |
2,731.8 |
5,533.8 |
2,406.7 |
2,490.0 |
4,896.7 |
85.9 |
91.1 |
88.5 |
| 20 - 24 |
2,927.0 |
2,842.3 |
5,769.3 |
2,255.5 |
2,243.9 |
4,499.5 |
77.1 |
78.9 |
78.0 |
| 25 - 29 |
2,957.4 |
2,855.8 |
5,813.2 |
2,138.8 |
2,161.5 |
4,300.2 |
72.3 |
75.7 |
74.0 |
| 30 - 34 |
2,846.7 |
2,742.0 |
5,588.8 |
2,060.6 |
1,925.2 |
3,985.8 |
72.4 |
70.2 |
71.3 |
| 35 - 39 |
2,607.2 |
2,578.5 |
5,185.7 |
1,806.4 |
1,713.9 |
3,520.3 |
69.3 |
66.5 |
67.9 |
| 40 - 44 |
2,348.2 |
2,402.2 |
4,750.3 |
1,591.0 |
1,457.1 |
3,048.1 |
67.8 |
60.7 |
64.2 |
| 45 - 49 |
2,108.0 |
2,160.4 |
4,268.3 |
1,378.5 |
1,173.5 |
2,552.0 |
65.4 |
54.3 |
59.8 |
| 50 - 54 |
1,726.7 |
1,813.0 |
3,539.7 |
1,039.4 |
860.7 |
1,900.1 |
60.2 |
47.5 |
53.7 |
| 55 - 59 |
1,290.4 |
1,382.6 |
2,673.1 |
788.5 |
597.7 |
1,386.2 |
61.1 |
43.2 |
51.9 |
| 60 - 64 |
1,032.1 |
1,157.9 |
2,189.9 |
539.1 |
463.4 |
1,002.5 |
52.2 |
40.0 |
45.8 |
| 65 - 69 |
827.4 |
962.6 |
1,789.9 |
415.4 |
306.3 |
721.7 |
50.2 |
31.8 |
40.3 |
| 70 - 74 |
568.9 |
686.5 |
1,255.4 |
257.0 |
141.0 |
398.0 |
45.2 |
20.5 |
31.7 |
| 75 and over |
525.5 |
706.0 |
1,231.5 |
169.1 |
125.6 |
294.7 |
32.2 |
17.8 |
23.9 |
| municipal area |
9,456.7 |
10,089.9 |
19,546.6 |
7,690.2 |
7,799.5 |
15,489.7 |
81.3 |
77.3 |
79.2 |
| 6 - 9 |
603.4 |
604.4 |
1,207.9 |
489.0 |
500.0 |
989.0 |
81.0 |
82.7 |
81.9 |
| 10 - 14 |
783.1 |
799.0 |
1,582.1 |
756.2 |
764.8 |
1,520.9 |
96.6 |
95.7 |
96.1 |
| 15 - 19 |
869.3 |
904.4 |
1,773.6 |
771.5 |
836.4 |
1,607.9 |
88.8 |
92.5 |
90.7 |
| 20 - 24 |
961.7 |
1,004.4 |
1,966.1 |
805.9 |
885.3 |
1,691.1 |
83.8 |
88.1 |
86.0 |
| 25 - 29 |
998.6 |
1,043.9 |
2,042.5 |
810.7 |
886.4 |
1,697.1 |
81.2 |
84.9 |
83.1 |
| 30 - 34 |
975.9 |
1,027.9 |
2,003.8 |
802.6 |
833.7 |
1,636.3 |
82.2 |
81.1 |
81.7 |
| 35 - 39 |
904.4 |
946.9 |
1,851.2 |
737.2 |
764.3 |
1,501.4 |
81.5 |
80.7 |
81.1 |
| 40 - 44 |
798.2 |
847.3 |
1,645.5 |
667.7 |
656.2 |
1,324.0 |
83.7 |
77.4 |
80.5 |
| 45 - 49 |
699.9 |
743.8 |
1,443.7 |
556.8 |
526.7 |
1,083.5 |
79.6 |
70.8 |
75.0 |
| 50 - 54 |
556.0 |
606.2 |
1,162.2 |
403.3 |
391.8 |
795.0 |
72.5 |
64.6 |
68.4 |
| 55 - 59 |
406.4 |
447.9 |
854.3 |
311.8 |
269.6 |
581.5 |
76.7 |
60.2 |
68.1 |
| 60 - 64 |
316.6 |
366.8 |
683.4 |
230.0 |
201.0 |
431.0 |
72.7 |
54.8 |
63.1 |
| 65 - 69 |
256.3 |
306.5 |
562.8 |
182.3 |
166.8 |
349.1 |
71.1 |
54.4 |
62.0 |
| 70 - 74 |
166.6 |
209.9 |
376.5 |
98.3 |
52.4 |
150.7 |
59.0 |
25.0 |
40.0 |
| 75 and over |
160.5 |
230.3 |
390.8 |
66.9 |
64.1 |
131.0 |
41.7 |
27.8 |
33.5 |
|
|
| |
| Age group/administrative area |
Population 6 years and over (number) |
Population 6 years and over with reading habit (number) |
population with reading habit (%) |
| male |
female |
total |
male |
female |
total |
male |
female |
total |
| total |
29,419.2 |
29,760.2 |
59,179.4 |
21,056.0 |
19,860.3 |
40,916.3 |
71.6 |
66.7 |
69.1 |
| non-municipal area |
19,962.4 |
19,670.4 |
39,632.8 |
13,365.8 |
12,060.8 |
25,426.6 |
67.0 |
61.3 |
64.2 |
| 6 - 9 |
1,519.2 |
1,466.5 |
2,985.7 |
1,147.5 |
1,138.0 |
2,285.5 |
75.5 |
77.6 |
76.5 |
| 10 - 14 |
1,945.9 |
1,868.8 |
3,814.7 |
1,817.1 |
1,797.9 |
3,614.9 |
93.4 |
96.2 |
94.8 |
| 15 - 19 |
1,932.8 |
1,827.5 |
3,760.2 |
1,635.2 |
1,653.6 |
3,288.8 |
84.6 |
90.5 |
87.5 |
| 20 - 24 |
1,965.2 |
1,837.9 |
3,803.1 |
1,449.7 |
1,358.7 |
2,808.3 |
73.8 |
73.9 |
73.8 |
| 25 - 29 |
1,958.9 |
1,811.8 |
3,770.7 |
1,328.1 |
1,275.0 |
2,603.1 |
67.8 |
70.4 |
69.0 |
| 30 - 34 |
1,870.9 |
1,714.1 |
3,585.0 |
1,258.1 |
1,091.5 |
2,349.5 |
67.2 |
63.7 |
65.5 |
| 35 - 39 |
1,702.8 |
1,631.6 |
3,334.5 |
1,069.2 |
949.7 |
2,018.9 |
62.8 |
58.2 |
60.5 |
| 40 - 44 |
1,550.0 |
1,554.8 |
3,104.8 |
923.3 |
800.9 |
1,724.2 |
59.6 |
51.5 |
55.5 |
| 45 - 49 |
1,408.1 |
1,416.6 |
2,824.6 |
821.8 |
646.8 |
1,468.5 |
58.4 |
45.7 |
52.0 |
| 50 - 54 |
1,170.7 |
1,206.8 |
2,377.6 |
636.2 |
468.9 |
1,105.0 |
54.3 |
38.9 |
46.5 |
| 55 - 59 |
884.0 |
934.7 |
1,818.7 |
476.7 |
328.0 |
804.7 |
53.9 |
35.1 |
44.2 |
| 60 - 64 |
715.5 |
791.0 |
1,506.6 |
309.1 |
262.4 |
571.4 |
43.2 |
33.2 |
37.9 |
| 65 - 69 |
571.0 |
656.0 |
1,227.1 |
233.2 |
139.5 |
372.6 |
40.8 |
21.3 |
30.4 |
| 70 - 74 |
402.3 |
476.6 |
878.9 |
158.7 |
88.6 |
247.3 |
39.4 |
18.6 |
28.1 |
| 75 and over |
365.0 |
475.7 |
840.7 |
102.2 |
61.5 |
163.7 |
28.0 |
12.9 |
19.5 |
|
|
| |
|
|
| |
|
|
| |
|
|
| |
|
|
| |
|
|
| |
|
|
| |
| |
| |
 |
|